Agent Dashboard Navigation
Navigating The Agent Dashboard
Learn how to effectively manage your sales pipeline and track performance metrics within the dashboard. This guide walks you through the essential settings and lead status updates needed to streamline your daily workflow.
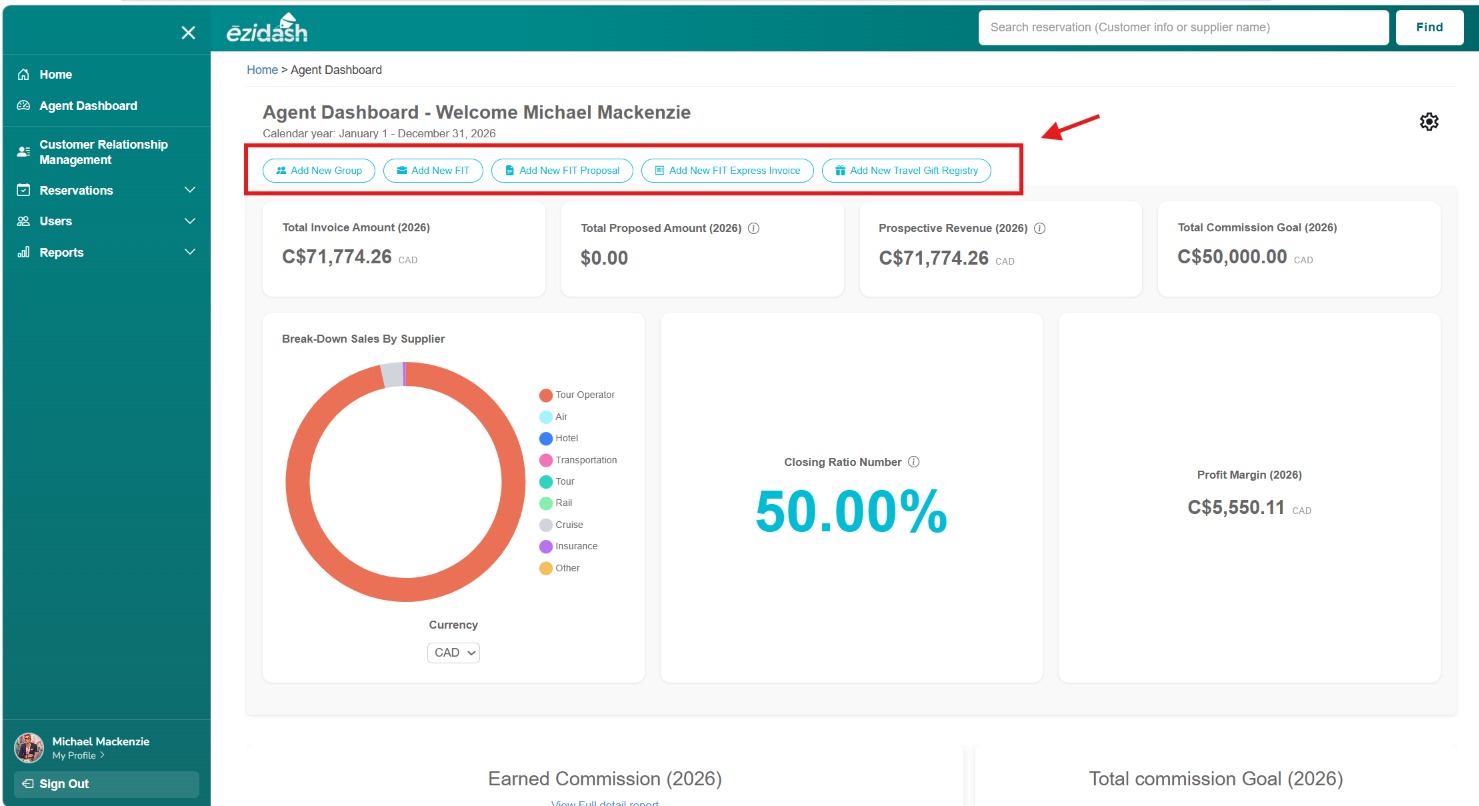
1. This is the agent dashboard. We're going to navigate around here so you can understand all of its features. The top menu buttons allows you to manage your reservations here including add a new group, add a new FIT, add a new FIT proposal, add a new FIT Express invoice or add a new travel gift registry.
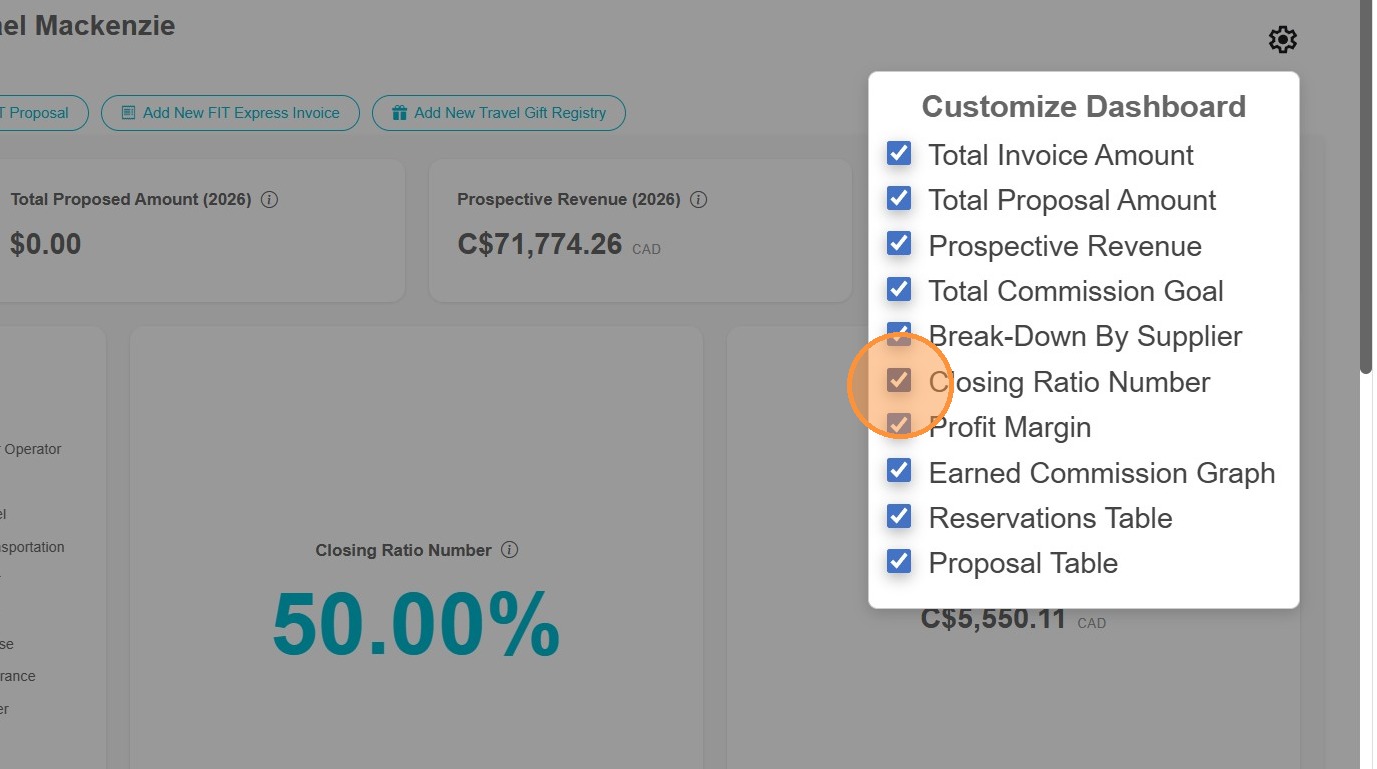
2. The Agent Dashboard will also provide you with the statistics of your reservations and travel quote proposals all in one place. You can customize your dashboard with what graphs and statistics you want to view by clicking on the top right cogwheel. Feel free to select or deselect these options including total invoice amount, total proposal amount, prospective revenue, total commission goal, breakdown by supplier closing ratio number, profit margin, earned commission graph, reservation table and proposal table. Let's say you didn't want to see the closing ratio and profit margin, you would simply deselect these options and they will disappear from your agent dashboard.
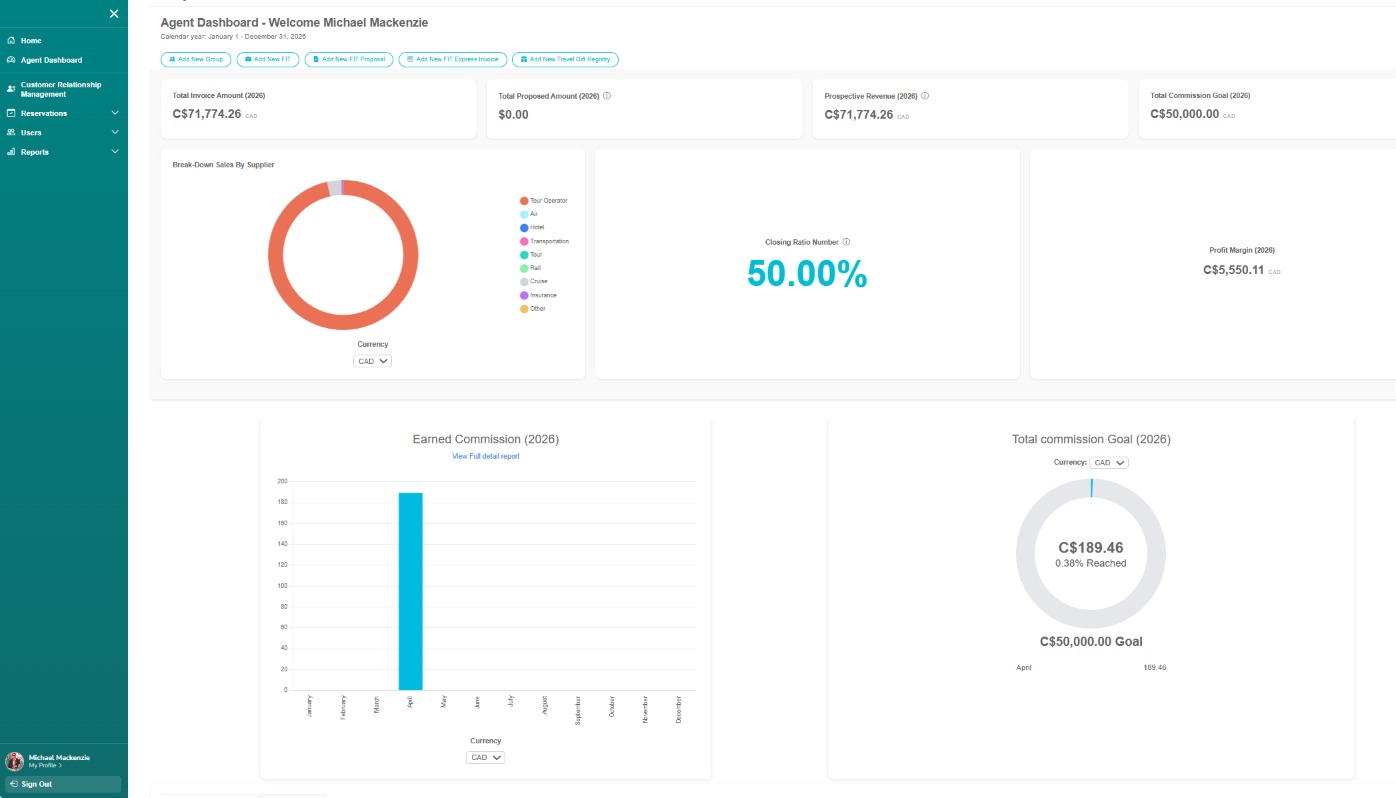
3. The first statistic shown on your agent dashboard is your total invoice amount. This is all of your invoiced bookings for the calendar year, January 1 to December 31. The next box will show your total proposed amounts. When you use the proposal feature in Ēzidash, the value of all of your unbooked travel quotes in the calendar year will be displayed here. Your prospective revenue will add your total invoice amount and total proposed amounts together to show your potential earnings for the calendar year. And then your total commission goal is what you've set under your agent profile. The break-down sales by supplier shows you a graph of your sales by travel category including tour operator, air, hotel, transportation, tour, rail, cruise, insurance, and other. The Closing Ratio statistic reflects the percentage amount of what travel proposals in the system converted to bookings. The total profit margin is your take-home commission for the calendar year, which will continue to accumulate as more bookings with expected commission to be received in this calendar year is added. The earned commission graph reflects all of the commission your agency has paid you thus far and when. The total commission goal graph does your success in achieving your goal reflecting paid commission towards this goal.
4. Once you scroll further down on your agent dashboard, you will see a list of your accounts receivables. This list details all of your reservations in date order of final payment deadlines with another tab for your early booking bonus (EBB) deadlines. These are the reservations that you will need with connect with your clients and ensure that their EBB and final payments are processed in time.
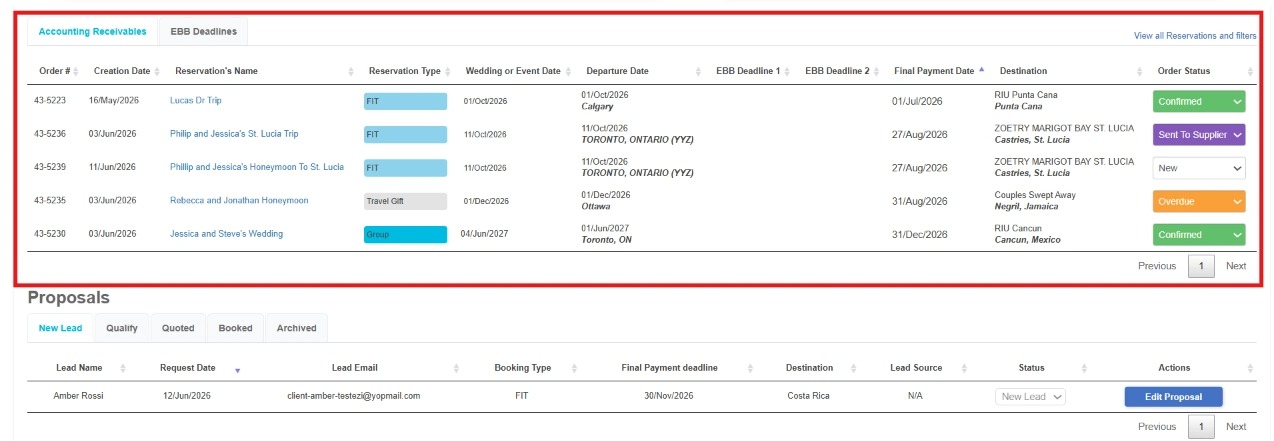
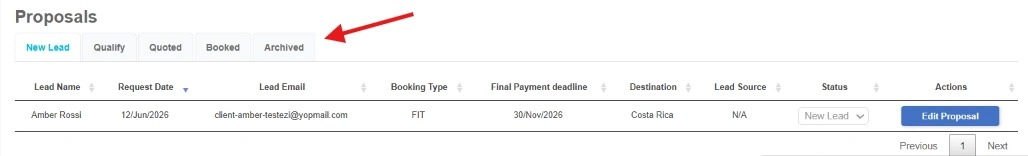
5. Below the accounts receivables section you will find the list of all of your proposals organized by tabs pertaining to the status of each of the proposals you've created. The first tab is "New lead" which displays all proposals that are brand new and that you need to work on. The second tab is "Qualify" which represents those proposals that you need to further quality. The third tab is "Quoted" which displays all of the proposals that you've completed and have sent out to your client and changed the status to "quoted". The next tab is "Booked" which represents those proposals that the client has submitted their booking request for. And the final tab is "Archives" representing those closed quotes that never transpired or booked. And this completes our tutorial on the summary of the agent dashboard.